Pythona yeni başladım ve okuldaki bi ödev için pipe dising kodu yazdım. Ama cıkan grafiklerde y değerini 1e6 olarak gözüküyor bunu nasıl düzeltebilirim? birde cost grafinde en düşük x degerini y değeriyle göestermem gerekiyor(örn. en düşük cost … dimensıon dadır.).
def pipe_desing():
import math
import matplotlib.pyplot as plt
L = 1400 # Length of the piping system
H = 7 # Height of discharge point from the lake and tank in distribution center
E = 0.0174 # Roughness of the pipe
t = 3777.72 # Time
p = 997 # Density
Q = 0.03632 # Flow rate
g = 9.81 # Gravity
k = 5 # loss factor ?????
visc = 0.001308 # Dinamik viscosity
d1 = float(input('Dimension of Start : '))
d2 = float(input('Dimension of End : '))
POWER = []
COST = []
HEADLOSS = []
DIMENSION = []
while d1 <= d2 :
D = d1
A = math.pi*((D/2)**2) # Area
V = Q/A # Velocity
Re=(p*V*D)/visc
if Re <= 4000:
f = 64/Re
else:
f = (1/(-1.8*(math.log10((((E/D)/3.7)**1.11)+(6.9/Re)))))**2
# LOSSES
H1=f*(L/D)*((V**2)/(2*g))
H2= 10*k*((V**2)/(2*g))
Ht = H1+H2+H # Total headloss
# POWER kW
PO= (p*Q*g*Ht)/1000
# COSTS dolar
Elc = (t*2*5*365*0.1*PO)/3600 # Electricity cost
pam = 3500+(100*Ht) # Pump and motor
val = 6*(300+(200*D/0.025)) # Valves
elb = 4*(50+(50*D/0.025)) # Elbows
pps = L*(D/0.025) # Pipes
tcost = Elc+pam+val+elb+pps # Total cost
POWER.append(PO)
COST.append(tcost)
HEADLOSS.append(Ht)
DIMENSION.append(D)
d1 +=0.01
plt.subplot()
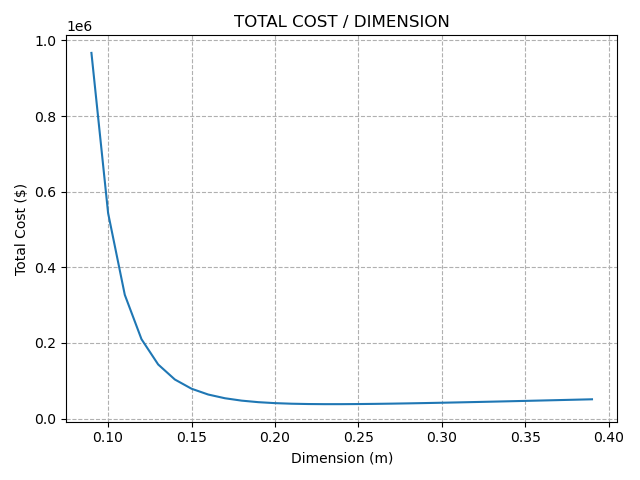
plt.plot(DIMENSION,COST)
plt.xlabel("Dimension (m)")
plt.ylabel("Total Cost ($)")
plt.title("TOTAL COST / DIMENSION")
plt.grid(linestyle='--')
plt.show()
plt.subplot()
plt.plot(DIMENSION,POWER)
plt.xlabel("Dimension (m)")
plt.ylabel("Power (kW)")
plt.title("POWER / DIMENSION")
plt.grid(linestyle='--')
plt.show()
plt.subplot()
plt.plot(DIMENSION,HEADLOSS)
plt.xlabel("Dimension (m)")
plt.ylabel("Headloss")
plt.title("HEADLOSS / DIMENSION")
plt.grid(linestyle='--')
plt.show()
pipe_desing()
