Arkadaşlar merhabalar,
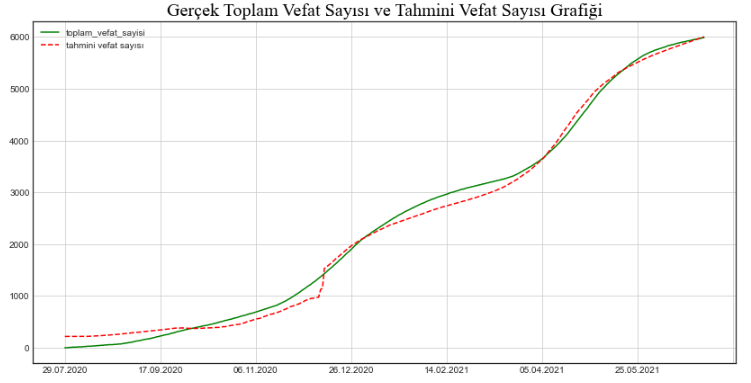
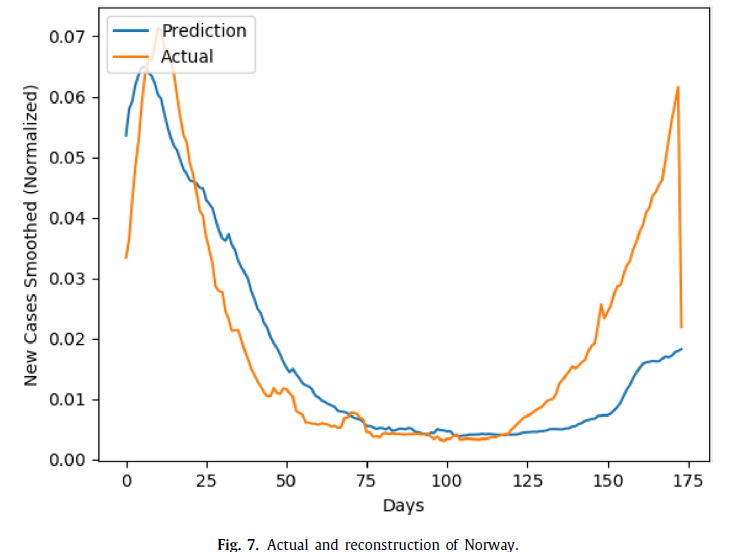
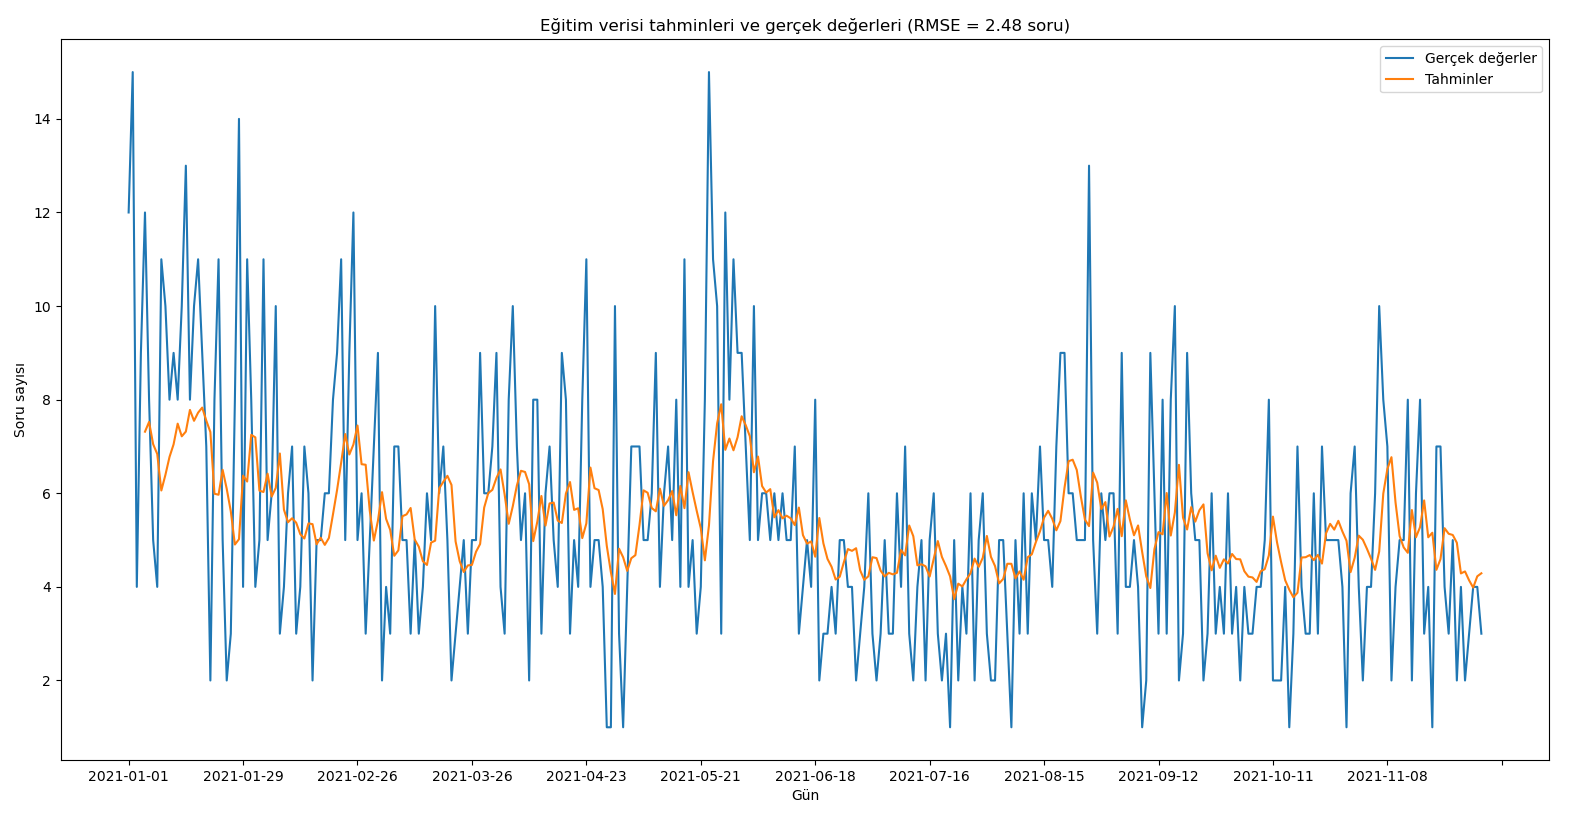
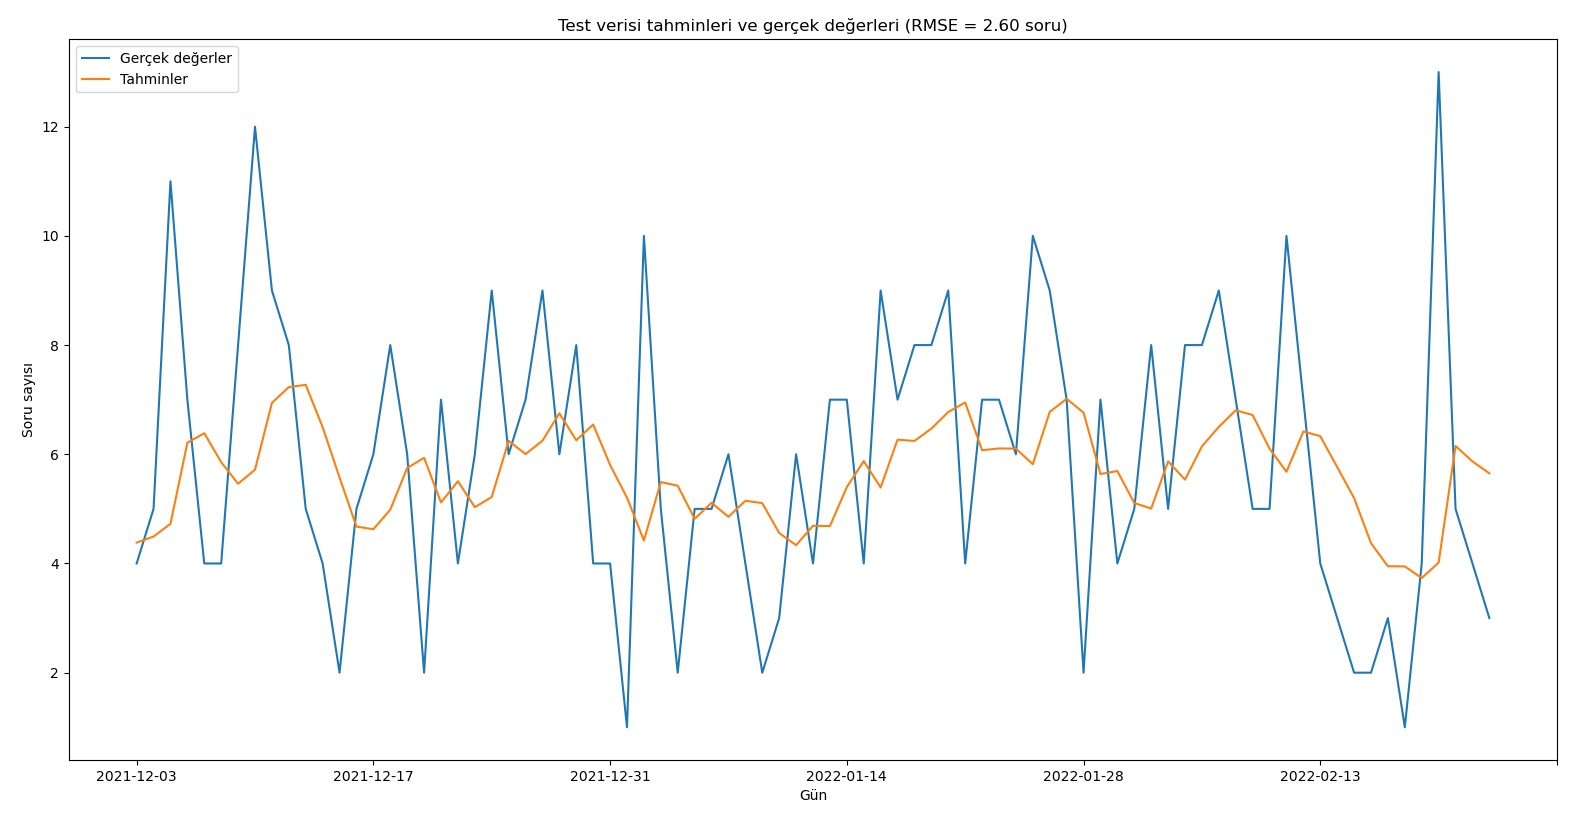
Ben çok katmanlı LSTM Modeller ile çalışıyorum. Burada elde ettiğim gerçek değerler ve tahmini değerleri ayrı ayrı grafiklerde gösterebiliyorum. Ancak gerçek sonuçlar ve tahmini sonuçları aynı grafik üzerinde nasıl göstereceğim bunu çözemedim. Bu konuda yardımcı olursanız çok sevinirim.
Covid19 sonuçları üzerinde çalışıyorum. Yaptığım çalışmam şu şekilde;
Kütüphaneleri yükledim ve verilerimi çekiyorum sonra da hesaplamalarımı yapıyorum. Grafiklerimi çizdiriyorum ancak dediğim gibi tahmini veri grafği ile gerçek değerlerin çizimini aynı grafikte gösteremiyorum. Bu konuda yardım edebilir misiniz. Çok teşekkür ediyorum şimdiden.
import os
import sys
os.chdir('/Users/onurk/Covid-19/')
import pandas as pd
import numpy as np
pd.options.display.max_columns=None
import plotly.graph_objects as go
import plotly.express as px
import matplotlib.pyplot as plt
import time
start = time.process_time()
from plotly.offline import init_notebook_mode, iplot
import warnings
from IPython.core.display import display, HTML
display(HTML("<style>.container { width:100% !important; }</style>"))
warnings.filterwarnings('ignore')
init_notebook_mode(connected=True)
import tensorflow as tf
tf.get_logger().setLevel('INFO')
tf.autograph.set_verbosity(0)
from tensorflow.keras import Sequential
from tensorflow.keras.layers import Dense
from tensorflow.keras.layers import LSTM
from tensorflow.keras.callbacks import Callback, ModelCheckpoint, EarlyStopping, ReduceLROnPlateau
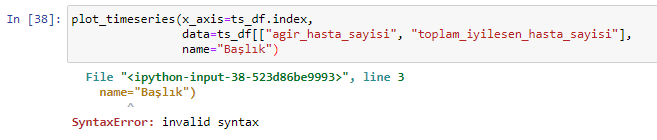
def plot_timeseries(x_axis,data,name):
    num_cols=data.shape[1]
    go_arr=[]
    for i in range(num_cols):
        go_arr.append(go.Scatter(x=x_axis, y=data.iloc[:,i],name=data.columns[i]))
    fig=go.Figure(go_arr)

    fig.update_layout(
    title=name,font=dict(
        family="Courier New, monospace",
        color="#7f7f6a"))
    fig.show()


def plot_lines(df, title='', annotations=None):
    common_kw = dict(x=df.index, mode='lines+markers')
    xaxis = dict(title='Time Steps')
    data=[]
    for c in df.columns:
        data.append(go.Scatter(y=df[c], name=c, **common_kw))

    layout = dict(title=title, showlegend=True, annotations=annotations, xaxis=xaxis)
    fig=dict(data=data, layout=layout)
    iplot(fig,show_link=True)
agir_hasta_sayisi_data_df=pd.read_csv('http://facadium.com.tr/lstm_dataset/agir_hasta_sayisi.csv')
toplam_iyilesen_hasta_sayisi_data_df=pd.read_csv('http://facadium.com.tr/lstm_dataset/toplam_iyilesen_hasta_sayisi.csv')
toplam_vefat_sayisi_data_df=pd.read_csv('http://facadium.com.tr/lstm_dataset/toplam_vefat_sayisi.csv')
toplam_vaka_sayisi_data_df=pd.read_csv('http://facadium.com.tr/lstm_dataset/toplam_vaka_sayisi.csv')
toplam_test_sayisi_data_df=pd.read_csv('http://facadium.com.tr/lstm_dataset/toplam_test_sayisi.csv')
country_pred_df=pd.DataFrame()
model_performance_df=pd.DataFrame()

def get_time_series_data(country_name):

    grouped_agir_hasta_sayisi_df=agir_hasta_sayisi_data_df.groupby('Country/Region')
    grouped_toplam_iyilesen_hasta_sayisi_df=toplam_iyilesen_hasta_sayisi_data_df.groupby('Country/Region')
    grouped_toplam_vefat_sayisi_df=toplam_vefat_sayisi_data_df.groupby('Country/Region')
    grouped_toplam_vaka_sayisi_df=toplam_vaka_sayisi_data_df.groupby('Country/Region')
    grouped_toplam_test_sayisi_df=toplam_test_sayisi_data_df.groupby('Country/Region')

    country_agir_hasta_sayisi_df=grouped_agir_hasta_sayisi_df.get_group(country_name)
    country_toplam_iyilesen_hasta_sayisi_df=grouped_toplam_iyilesen_hasta_sayisi_df.get_group(country_name)
    country_toplam_vefat_sayisi_df=grouped_toplam_vefat_sayisi_df.get_group(country_name)
    country_toplam_vaka_sayisi_df=grouped_toplam_vaka_sayisi_df.get_group(country_name)
    country_toplam_test_sayisi_df=grouped_toplam_test_sayisi_df.get_group(country_name)

    cleaned_agir_hasta_sayisi_df=country_agir_hasta_sayisi_df.drop(columns=['Province/State','Lat','Long']).sum(axis=0,skipna=True).to_frame()[1:]
    cleaned_toplam_iyilesen_hasta_sayisi_df=country_toplam_iyilesen_hasta_sayisi_df.drop(columns=['Province/State','Lat','Long']).sum(axis=0,skipna=True).to_frame()[1:]
    cleaned_toplam_vefat_sayisi_df=country_toplam_vefat_sayisi_df.drop(columns=['Province/State','Lat','Long']).sum(axis=0,skipna=True).to_frame()[1:]
    cleaned_toplam_vaka_sayisi_df=country_toplam_vaka_sayisi_df.drop(columns=['Province/State','Lat','Long']).sum(axis=0,skipna=True).to_frame()[1:]
    cleaned_toplam_test_sayisi_df=country_toplam_test_sayisi_df.drop(columns=['Province/State','Lat','Long']).sum(axis=0,skipna=True).to_frame()[1:]

    ts_df=pd.DataFrame(cleaned_agir_hasta_sayisi_df.values,columns=['agir_hasta_sayisi'])
    ts_df['toplam_iyilesen_hasta_sayisi']=cleaned_toplam_iyilesen_hasta_sayisi_df.values
    ts_df['toplam_vefat_sayisi']=cleaned_toplam_vefat_sayisi_df.values
    ts_df['toplam_vaka_sayisi']=cleaned_toplam_vaka_sayisi_df.values
    ts_df['toplam_test_sayisi']=cleaned_toplam_test_sayisi_df.values

    ts_df.index=cleaned_agir_hasta_sayisi_df.index
    return ts_df
def plot(ts_df,country_name):
    plot_timeseries(x_axis=ts_df.index,data=ts_df[['agir_hasta_sayisi','toplam_iyilesen_hasta_sayisi','toplam_vefat_sayisi','toplam_vaka_sayisi','toplam_test_sayisi']],name='Degerlerin Karşılaştırması '+country_name)
def split_sequence(sequence, n_steps):
    X, y = list(), list()
    for i in range(len(sequence)):
        end_ix = i + n_steps
        if end_ix > len(sequence)-1:
            break
        seq_x, seq_y = sequence[i:end_ix], sequence[end_ix]
        X.append(seq_x)
        y.append(seq_y)
    return np.asarray(X), np.asarray(y)
def build_model_and_predict(ts_df, country_name):
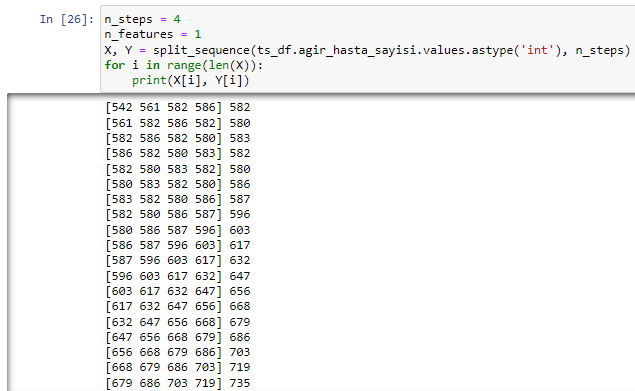
n_steps = 4
n_features = 1
n_test = 4
X, Y = split_sequence(ts_df.agir_hasta_sayisi.values.astype('float32'), n_steps)
X = X.reshape((X.shape[0], X.shape[1], n_features))
X_train, X_test, Y_train, Y_test = X[:-n_test], X[-n_test:], Y[:-n_test], Y[-n_test:]
c = [
ModelCheckpoint(country_name+'.hdf5', save_best_only=True, monitor='val_loss', mode='min', verbose=0, save_freq=1),
EarlyStopping(monitor='val_loss', min_delta=0, patience=600, verbose=0),
ReduceLROnPlateau(monitor='val_loss',factor=0.2,patience=5,min_lr=0.00001)
]
model = Sequential()
model.add(LSTM(100, return_sequences=True, input_shape=(n_steps,1)))
model.add(LSTM(100, return_sequences=True))
model.add(LSTM(100))
model.add(Dense(1))
model.compile(optimizer='adam', loss='mse', metrics=['mae','mse','accuracy'])
history=model.fit(X_train, Y_train, epochs=4000, batch_size=32, verbose=0,callbacks=c,validation_data=(X_test, Y_test),shuffle=False)
[mse, mae, loss, accuracy]= model.evaluate(X_test, Y_test, batch_size=32, verbose=0)
model_performance=pd.DataFrame({'Country':[country_name],'mae':np.array(mae),'mse':np.array(mse),
'rmse':np.array(np.sqrt(mse)),'accuracy':np.array(accuracy)})
row = np.asarray(ts_df[-n_steps:].agir_hasta_sayisi.values.astype('float32')).reshape((1, n_steps, n_features))
yhat = model.predict(row)
return yhat, model_performance
ts_df=get_time_series_data('Turkiye')
plot(ts_df,'Turkiye')
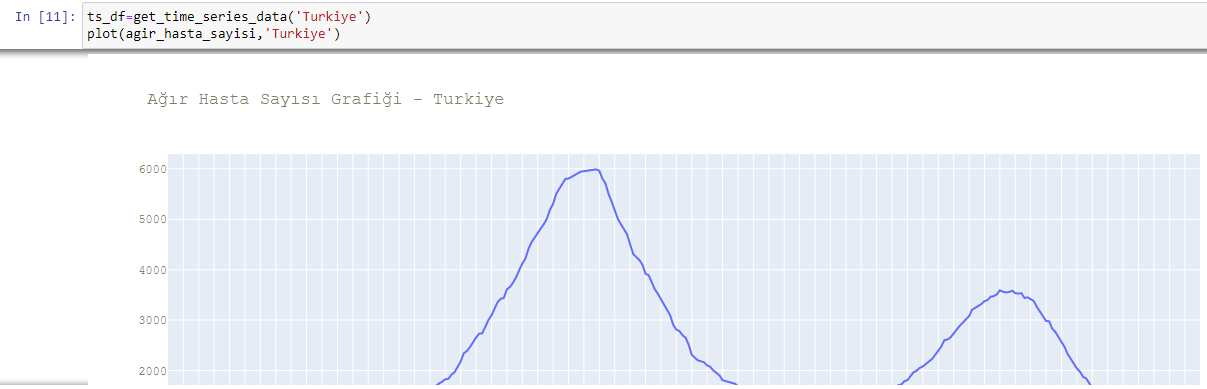
def plot(agir_hasta_sayisi,country_name):
    plot_timeseries(x_axis=ts_df.index,data=ts_df[['agir_hasta_sayisi']],name='Ağır Hasta Sayısı Grafiği - '+country_name)
pd.set_option("display.max.rows", None)
agir_hasta_sayisi=get_time_series_data('Turkiye')
agir_hasta_sayisi
ts_df=get_time_series_data('Turkiye')
plot(agir_hasta_sayisi,'Turkiye')
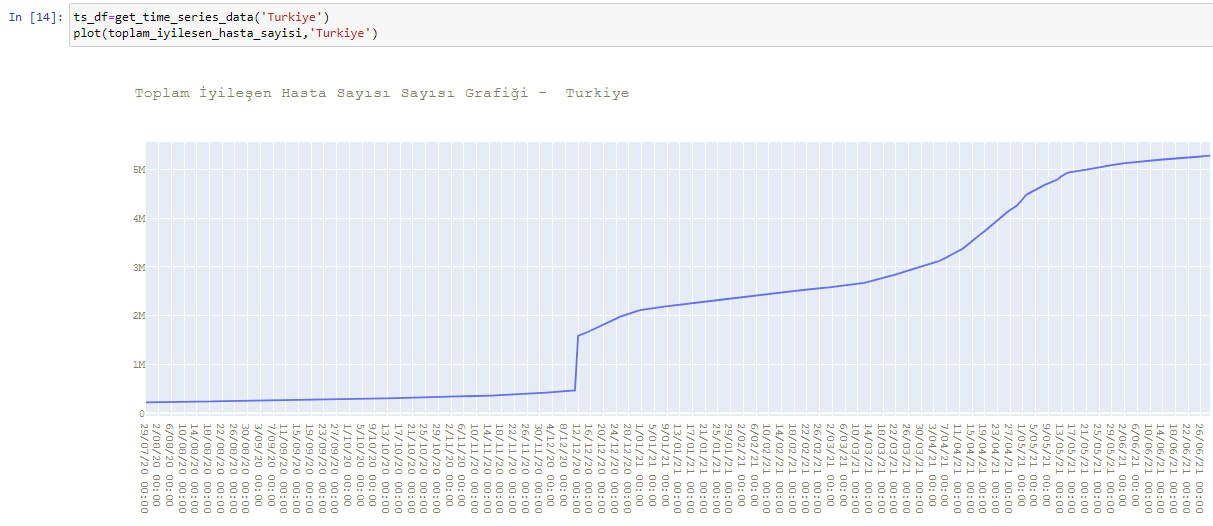
def plot(toplam_iyilesen_hasta_sayisi,country_name):
    plot_timeseries(x_axis=ts_df.index,data=ts_df[['toplam_iyilesen_hasta_sayisi']],name='Toplam İyileşen Hasta Sayısı Sayısı Grafiği -  '+country_name)
pd.set_option("display.max.rows", None)
toplam_iyilesen_hasta_sayisi=get_time_series_data('Turkiye')
toplam_iyilesen_hasta_sayisi
ts_df=get_time_series_data('Turkiye')
plot(toplam_iyilesen_hasta_sayisi,'Turkiye')
def plot(toplam_vefat_sayisi,country_name):
    plot_timeseries(x_axis=ts_df.index,data=ts_df[['toplam_vefat_sayisi']],name='Toplam Vefat Sayısı Grafiği -  '+country_name)
pd.set_option("display.max.rows", None)
toplam_vefat_sayisi=get_time_series_data('Turkiye')
toplam_vefat_sayisi
ts_df=get_time_series_data('Turkiye')
plot(toplam_vefat_sayisi,'Turkiye')
def plot(toplam_vaka_sayisi,country_name):
    plot_timeseries(x_axis=ts_df.index,data=ts_df[['toplam_vaka_sayisi']],name='Toplam Vaka Sayısı Grafiği - '+country_name)
pd.set_option("display.max.rows", None)
toplam_vaka_sayisi=get_time_series_data('Turkiye')
toplam_vaka_sayisi
ts_df=get_time_series_data('Turkiye')
plot(toplam_vaka_sayisi,'Turkiye')
def plot(toplam_test_sayisi,country_name):
    plot_timeseries(x_axis=ts_df.index,data=ts_df[['toplam_test_sayisi']],name='Toplam Test Sayısı Grafiği - '+country_name)
pd.set_option("display.max.rows", None)
toplam_test_sayisi=get_time_series_data('Turkiye')
toplam_test_sayisi
ts_df=get_time_series_data('Turkiye')
plot(toplam_test_sayisi,'Turkiye')
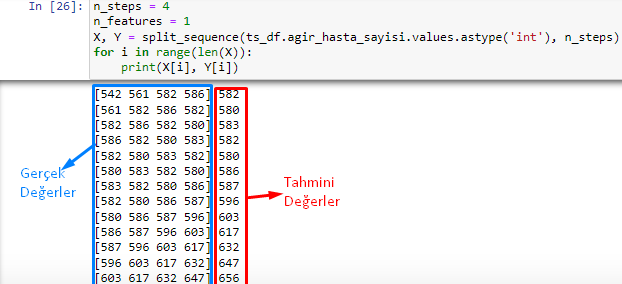
n_steps = 4
n_features = 1
X, Y = split_sequence(ts_df.agir_hasta_sayisi.values.astype('int'), n_steps)
for i in range(len(X)):
    print(X[i], Y[i])
country_names=['Turkiye']
for country_name in country_names:
    ts_df=get_time_series_data(country_name)
    yhat, model_performance = build_model_and_predict(ts_df,country_name)
    prediction=round(yhat[0][0])
    model_performance_df=model_performance_df.append(model_performance)
    country_pred_df=country_pred_df.append(pd.DataFrame({'Turkiye':[country_name],'SonDeger':ts_df[-1:].agir_hasta_sayisi.values,'TahminiDeger':np.array(prediction)}))
country_pred_df=country_pred_df.reset_index(drop=True)
country_pred_df=country_pred_df.sort_values(by='TahminiDeger',ascending=False)

fig = go.Figure()
fig.add_trace(go.Bar(x=country_pred_df['Turkiye'].values,
                y=country_pred_df['SonDeger'].values,
                name='# Dünkü Vakalar (Gerçek) ',
                marker_color='rgb(55, 83, 109)'
                ))
fig.add_trace(go.Bar(x=country_pred_df['Turkiye'].values,
                y=country_pred_df['TahminiDeger'].values,
                name='# Bugünkü Vakalar (Tahmini) ',
                marker_color='rgb(26, 118, 255)'
                ))

fig.update_layout(
    title='Ertesi Gün için Vaka Sayısını Tahmin Etmek için LSTM Modeli ',
    xaxis_tickfont_size=14,
    yaxis=dict(
        title='Vaka Sayısı',
        titlefont_size=16,
        tickfont_size=14,
    ),
    legend=dict(
        x=0,
        y=1.0,
        bgcolor='rgba(255, 255, 255, 0)',
        bordercolor='rgba(255, 255, 255, 0)'
    ),
    barmode='group',
    bargap=0.15,
    bargroupgap=0.1
)
fig.show()
country_pred_df=country_pred_df.sort_values(by='Turkiye')
country_pred_df.index=country_pred_df['Turkiye']
country_pred_df=country_pred_df.drop(columns=['Turkiye'])

country_pred_df
print('Toplam Süre : '+str((time.process_time() - start)/3600)+' hours')
print('Toplam Süre : '+str((time.process_time() - start)/60)+' mins')
plot_lines(country_pred_df,'Son Değer - Tahmini Değer')
model_performance_df.index=model_performance_df['Country'].values
model_performance_df=model_performance_df.drop(columns=['Country'])
plot_lines(model_performance_df)
model_performance_df
print('Toplam Süre : '+str((time.process_time() - start)/60)+' mins')